NEWS RELEASE: SUPPLEMENTAL REPORT
|
INCIDENT: |
Oxnard’s 2022 Uniform Crime Reporting Statistics |
|
DATE/TIME: |
February 22, 2023, 5:00 PM |
|
PREPARED BY: |
Jason Benites, Chief of Police |
|
CONTACT PERSON AND CONTACT INFO: |
Alex Arnett, Investigative Services Bureau Commander alex.arnett@oxnardpd.org; (805) 385-7620 |
DETAILS:
The purpose of this supplemental news release is to provide detailed information about Oxnard’s crime statistics for 2022.
In 1930, the national Uniform Crime Reporting (UCR) Program was created as a way for the federal government to collect a reliable set of crime statistics from city, county, state, tribal, and federal law enforcement agencies throughout the country. The Oxnard Police Department has been contributing UCR statistics for five (5) decades.
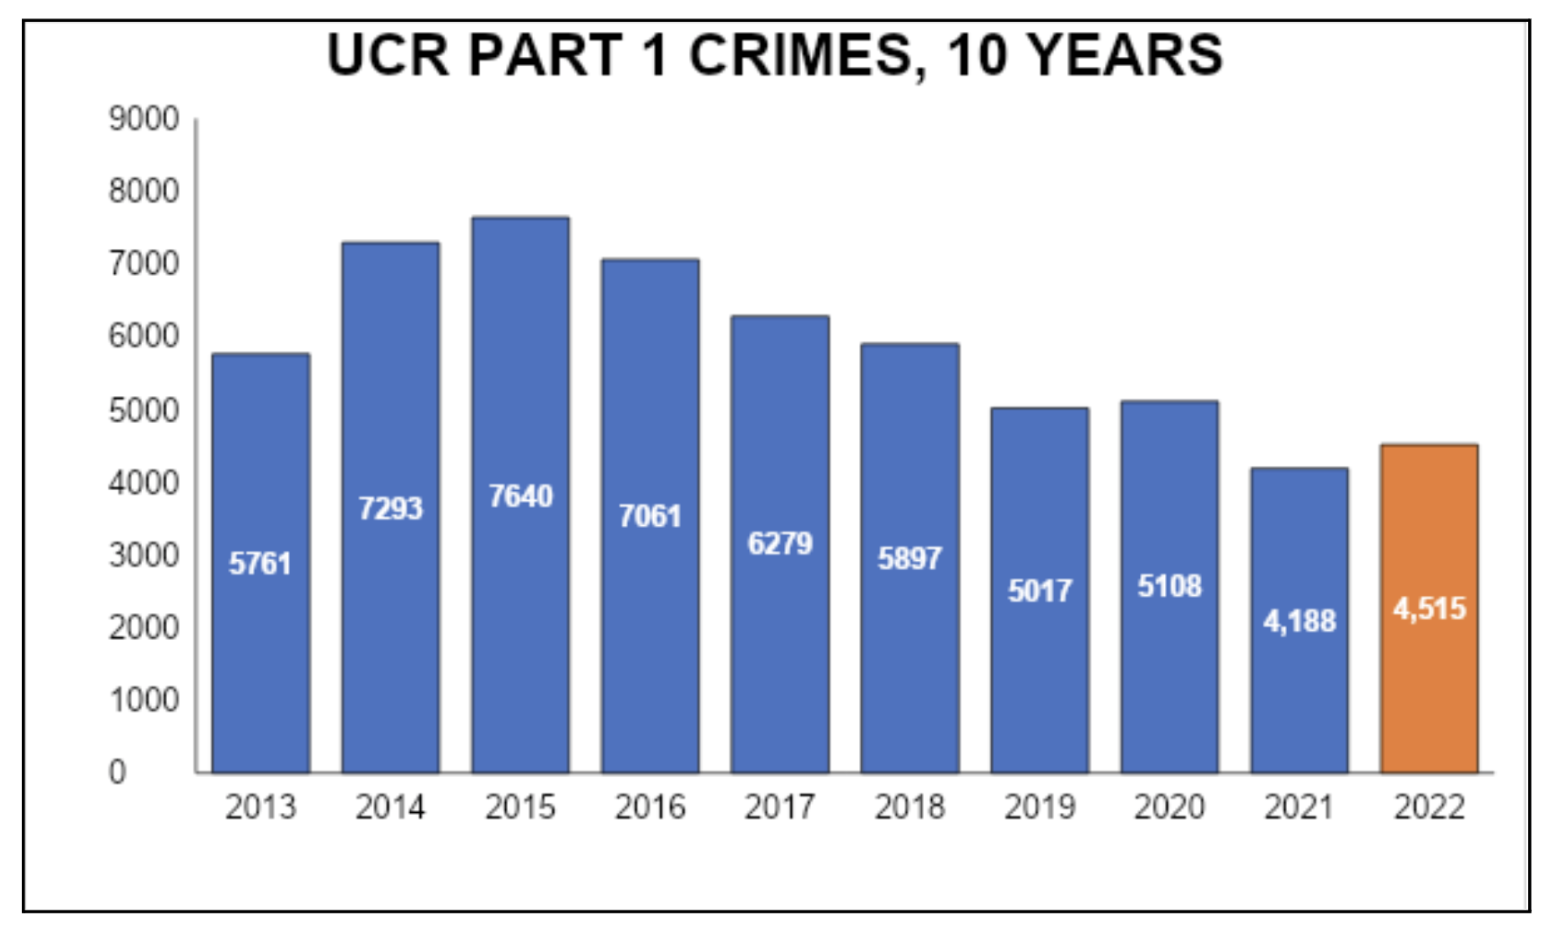
The crime statistics in this news release are consistent with UCR’s Summary Reporting System (SRS) reporting standards for the entire year of 2022. SRS uses a hierarchical system to prioritize and categorize offenses. The hierarchy rule requires that an incident with multiple offenses or charges is narrowed down to a single offense, usually the most serious charge. The Part I schedule includes the crimes in the following table:
|
Part I Crime |
2021 |
2022 |
Percent Change |
Num. Diff. |
|
Violent Crimes |
|
|
|
|
|
Homicide |
13 |
9 |
-30.8% |
-4 |
|
Rape |
82 |
83 |
1.2% |
1 |
|
Robbery |
183 |
221 |
20.8% |
38 |
|
Aggr. Assault |
415 |
513 |
23.6% |
98 |
|
Total |
693 |
826 |
19.2% |
133 |
|
Property Crimes |
|
|
|
|
|
Burglary |
428 |
538 |
25.7% |
110 |
|
Motor Veh. Theft |
461 |
610 |
32.3% |
149 |
|
Larceny (Theft) |
2,538 |
2,482 |
-2.2% |
-56 |
|
Arson |
68 |
59 |
-13.2% |
-9 |
|
Total |
3,495 |
3,689 |
5.6% |
194 |
|
Grand Total |
4,188 |
4,515 |
7.81% |
327 |
Homicides
For crime classification and reporting purposes, the Federal Bureau of Investigation and the California Department of Justice define homicide as “the willful (non-negligent) killing of one human being by another.” Based on the reporting criteria, the Oxnard Police Department reported nine (9) homicides in 2022. Four (4) of the nine (9) homicides were gang-related. Eight (8) involved a firearm, and one (1) involved a knife.
|
Homicides |
2021 |
2022 |
% CHG |
NUM DIFF |
|
FIREARM |
7 |
8 |
14.3% |
1 |
|
KNIFE |
4 |
1 |
-75.0% |
-3 |
|
VEHICLE |
2 |
0 |
-100.0% |
-2 |
|
HANDS, FEET, FIST |
0 |
0 |
N/A |
0 |
|
Total |
13 |
9 |
-30.8% |
-4 |
Regarding the victim-offender relationship in the homicides, four (4) were strangers, two (2) were acquaintances, one (1) was domestic-related, and two (2) had no known or an unknown relationship.
|
Homicide Victim-Offender Relationship |
2022 |
|
STRANGER |
4 |
|
ACQUAINTANCE |
2 |
|
UNKNOWN |
2 |
|
DOMESTIC |
1 |
|
Total |
9 |
Of the nine (9) homicides reported in 2022, two (2) homicide offenses were cleared by arrest. Additionally, there was one (1) arrest for a prior year homicide (2017).
|
Homicide Clearances |
2022 |
|
Homicides |
9 |
|
Arrests |
3 |
|
Total |
33% |
Rape
For purposes of crime classification and reporting, the Federal Bureau of Investigation and the California Department of Justice define rape as “penetration, no matter how slight, of the vagina or anus with any body part or object, or oral penetration by a sex organ of another person, without the consent of the victim.” Based on the reporting criteria, the Oxnard Police Department reported 83 offenses to the FBI.
|
Rape |
2021 |
2022 |
Percent Change |
Num. Diff. |
|
Rape |
81 |
82 |
1.2% |
1 |
|
Attempted Rape |
1 |
1 |
0.0% |
0 |
|
Total |
82 |
83 |
1.2% |
1 |
Robbery
For crime classification and reporting, the Federal Bureau of Investigation and the Department of Justice define robbery as “the taking or attempting to take anything of value from the care, custody, or control of a person or persons by force or threat of force or violence or by putting the victim in fear.”
|
Robbery |
2021 |
2022 |
Percent Change |
Num. Diff. |
|
Weapon Type |
|
|
|
|
|
Firearm |
47 |
40 |
-14.9% |
-7 |
|
Knife |
39 |
52 |
33.3% |
13 |
|
Other |
28 |
37 |
32.1% |
9 |
|
Strong Arm |
69 |
92 |
33.3% |
23 |
|
Total |
183 |
221 |
20.8% |
38 |
The number of robberies increased from 183 in 2021 to 221 in 2022 with a total of 38 more robbery crimes. The increases occurred in robberies to a business (20 more crimes, an increase of 34.5%) and robberies to a person (22 more crimes, an increase of 21.6%). There was a decrease in carjacking crimes, with four (4) fewer carjackings, a decrease of 17.4%.
Aggravated Assault
For purposes of crime classification and reporting, the Federal Bureau of Investigation and the California Department of Justice define aggravated assault as “an unlawful attack by one person upon another for the purpose of inflicting severe or aggravated bodily injury. This type of assault involves a weapon or by means likely to produce death or great bodily harm.”
|
Aggravated Assaults |
2021 |
2022 |
Percent Change |
Num. Diff. |
|
Firearm |
121 |
180 |
48.8% |
59 |
|
Knife |
139 |
132 |
-5.0% |
-7 |
|
Other Weapon (clubs, blunt objects, etc.) |
125 |
143 |
14.4% |
18 |
|
Personal Weapons (feet, fists, hands, etc.) |
30 |
58 |
93.3% |
28 |
|
Total |
415 |
513 |
23.6% |
98 |
Aggravated assaults increased by 23.6% with 98 more aggravated assaults in 2022 as compared to reported in 2021. The aggravated assaults category is broad. The relationships between the victim and offender(s) are broken down as follows:
|
Assault Relationship Types |
2022 |
|
UNKNOWN OR RANDOM |
170 |
|
DOMESTIC OR FAMILY RELATED |
94 |
|
ACQUAINTANCES |
85 |
|
GANG/TAGGER SUSPECTED |
56 |
|
TRANSIENT-RELATED |
35 |
|
ROAD RAGE |
21 |
|
ASSAULTS ON OFFICERS |
18 |
|
SHOTS FIRED |
18 |
|
BAR FIGHT / PARTY |
16 |
|
Grand Total |
513 |
Burglary
For purposes of crime classification and reporting, the Federal Bureau of Investigation and the California Department of Justice define burglary as “the unlawful entry of a structure to commit a felony or a theft.”
|
Burglary |
2021 |
2022 |
Percent Change |
Num. Diff. |
|
Residential |
212 |
263 |
24.1% |
51 |
|
Commercial |
216 |
275 |
27.3% |
59 |
|
Total |
428 |
538 |
25.7% |
110 |
The number of burglaries increased 25.7%, or 110 more crimes. The increase occurred in both categories, with 51 more burglary crimes to a residence, an increase of 24.1%, and 59 more burglary crimes to a commercial structure, an increase of 27.3%.
Larceny (Thefts)
For purposes of crime classification and reporting, the Federal Bureau of Investigation and the California Department of Justice define larceny as “an unlawful taking, carrying, leading, or riding away of property from the possession or constructive possession of another.
|
Larcenies |
2021 |
2022 |
Percent Change |
Num. Diff. |
|
Shoplift |
708 |
597 |
-15.7% |
-111 |
|
From Motor Vehicle |
822 |
774 |
-5.8% |
-48 |
|
Motor Vehicle Parts |
380 |
405 |
6.6% |
25 |
|
Bicycles |
73 |
125 |
71.2% |
52 |
|
From Building |
152 |
147 |
-3.3% |
-5 |
|
Coin-Op Machines |
6 |
5 |
-16.7% |
-1 |
|
Pocket Picking |
2 |
5 |
150.0% |
3 |
|
Purse Snatch |
0 |
1 |
N/A |
1 |
|
All Other |
395 |
423 |
7.1% |
28 |
|
Total |
2,538 |
2,482 |
-2.2% |
-56 |
The crime category of larceny (theft) decreased by 2.2% overall. There were 2,482 larcenies reported in 2022 compared to 2,538 reported in 2021, a decrease of 56 incidents.
Motor Vehicle Theft
For crime classification and reporting purposes, the Federal Bureau of Investigation and the California Department of Justice define motor vehicle theft as “the theft or attempted theft of a motor vehicle.” A motor vehicle is defined as a self-propelled vehicle that runs on land or surface.
|
Motor Vehicle Theft |
2021 |
2022 |
% CHG |
NUM DIFF |
|
Auto / SUV |
300 |
404 |
34.7% |
104 |
|
Truck / Buses |
131 |
169 |
29.0% |
38 |
|
Other Veh (M/C) |
30 |
37 |
23.3% |
7 |
|
Total |
461 |
610 |
32.3% |
149 |
Motor vehicle theft increased by 32.3%. There were 610 motor vehicle thefts reported in 2022 and 461 during 2021, an increase of 149 crimes. Many of these vehicle thefts were preventable, e.g., vehicle’s keys not secured and were readily available or vehicle was left running while unattended. Approximately 27%, or 165 car thefts, were preventable.
|
Stolen MO |
2022 |
|
Preventable (165) |
165 |
|
Unpreventable (445) |
445 |
|
Total |
610 |
|
Top Stolen Vehicles |
Count |
% of Total |
|
Chevy Silverado |
76 |
12.5% |
|
Honda Civic |
66 |
10.8% |
|
Total |
142 |
23.3% |
Arson
For purposes of crime classification and reporting, the Federal Bureau of Investigation and the California Department of Justice define arson as “any willful or malicious burning or attempt to burn, with or without intent to defraud, a dwelling house, public building, motor vehicle or aircraft, personal property of another, etc.”
|
Arson |
2021 |
2022 |
Percent Change |
Num. Diff. |
|
Residential |
7 |
2 |
-71.4% |
-5 |
|
Other Residential |
7 |
5 |
-28.6% |
-2 |
|
Storage |
1 |
1 |
0.0% |
0 |
|
Industrial / Manufacturing |
0 |
1 |
N/A |
1 |
|
Other Commercial |
11 |
10 |
-9.1% |
-1 |
|
Community / Public |
16 |
9 |
-43.8% |
-7 |
|
All Other Structure |
2 |
11 |
450.0% |
9 |
|
Motor Vehicle |
19 |
14 |
-26.3% |
-5 |
|
Other Mobile |
2 |
2 |
0.0% |
0 |
|
Other |
3 |
4 |
33.3% |
1 |
|
Total |
68 |
59 |
-13.2% |
-9 |
During 2022, there were 59 reported arson incidents compared to 68 in 2021, a decrease of 13.2%, or nine (9) fewer crimes. The largest decrease was in arson to a residence, which decreased by five (5) incidents, or 71.4%, to a total of two (2) residential arson crimes in 2022.
A Final Look at UCR 2022
The Oxnard Police Department is reporting 2023 crime statistics through the National Incident-Based Reporting System (NIBRS). Future press releases will contain crime statistics following NIBRS reporting standards.